What the program does in detail:
EmotionViz is a program that converts an audio file into an interpretable emotional timeline. It uses the Valence-Arousal (VA) space, where Arousal is a measure of energy or excitation, and Valence represents pleasantness or stability. The program outputs time-series curves, a VA "trajectory" plot, and a mel-spectrogram with overlays to visualize the data.
How It Works
The program uses a four-stage process to analyze the audio and produce the visualizations.
1. Signal → Features
The audio signal is first converted into a set of features. This involves using a Short-time Fast Fourier Transform (STFT) to get mel bands and extracting other features such as:
RMS (Root Mean Square)
Spectral centroid/flatness
Onset density
Harmonic vs. percussive energy (HPSS)
"Majorness" from chroma
2. Mapping to VA
The extracted features are then mapped to the Valence-Arousal space. This can be done using a tunable heuristic (a set of weights) or an optional learned CRNN (Convolutional Recurrent Neural Network) checkpoint. The outputs are z-scored per track, meaning they are normalized relative to the average of that specific song.
3. Visuals that Teach/Diagnose
The program creates several visual outputs to help the user understand the emotional timeline:
VA time-series: Shows how intensity (Arousal) and pleasantness (Valence) rise and fall over time.
VA trajectory: A phase-plane view that visualizes the song’s "emotional orbit."
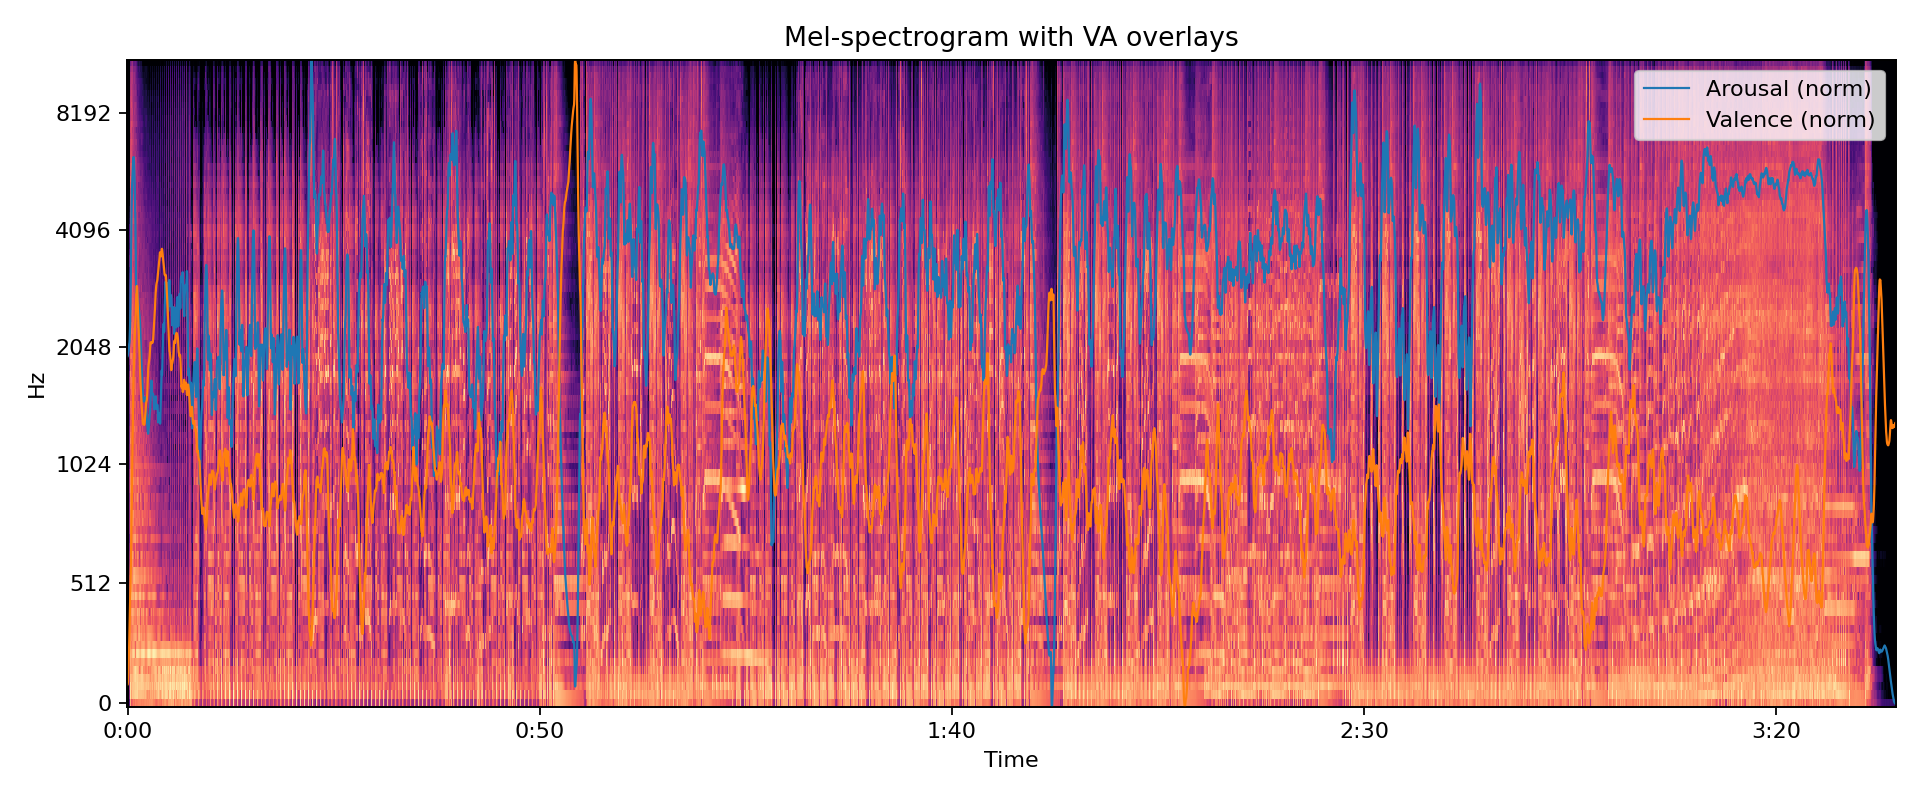
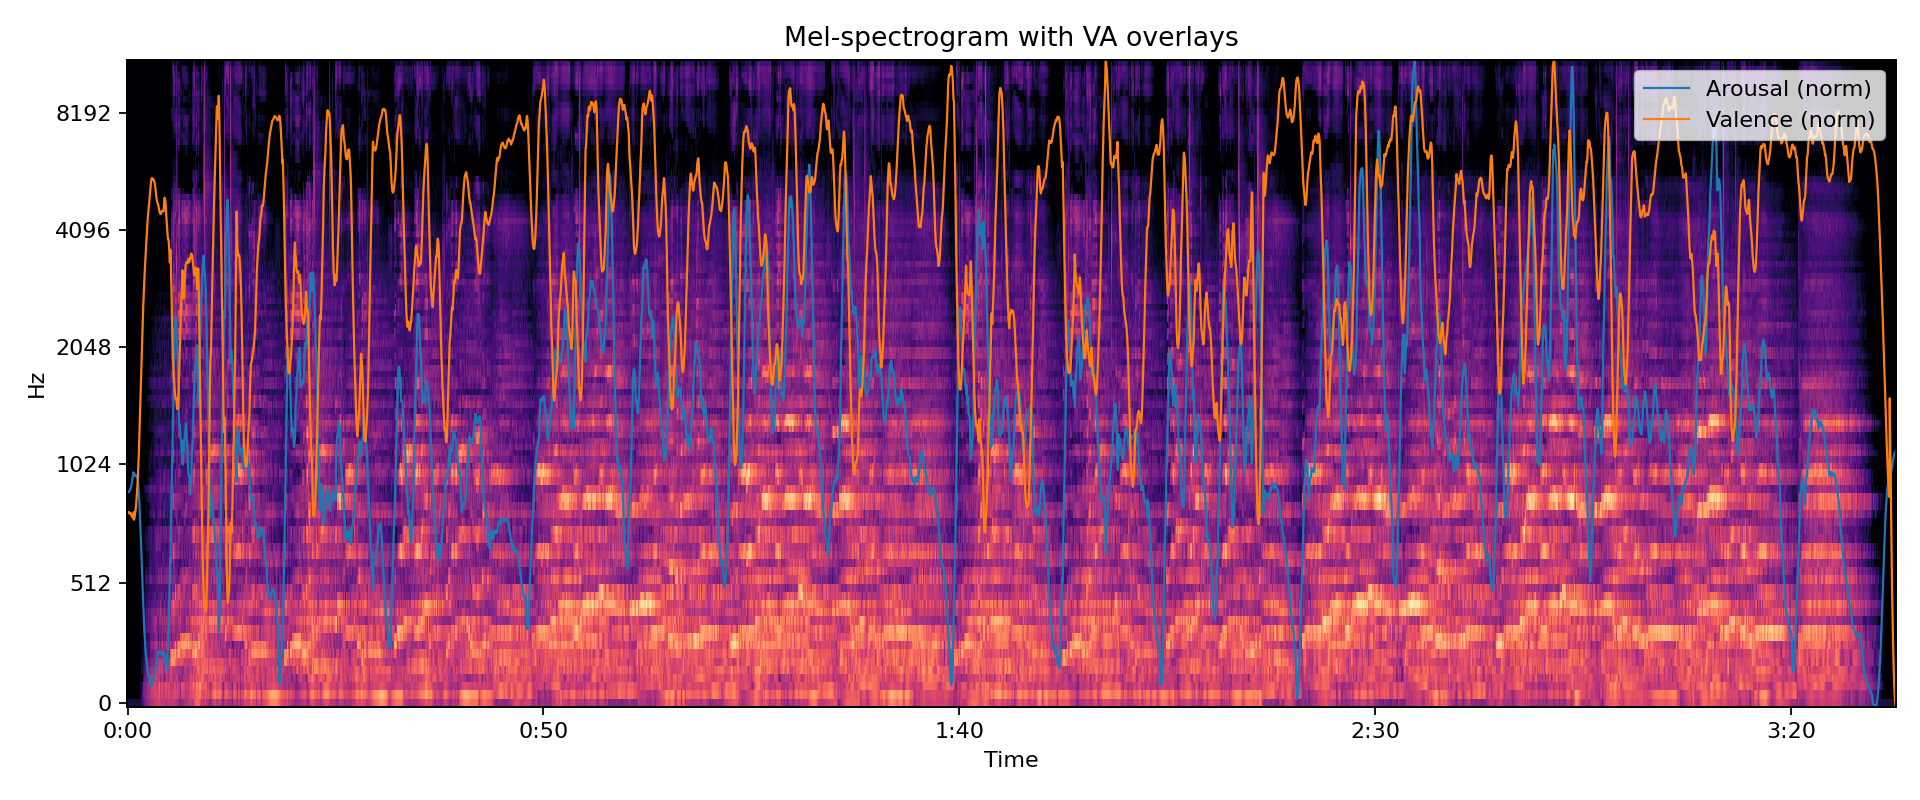
Mel + overlays: A mel-spectrogram with overlays that show the specific spectral events causing the emotional curves to move.
4. Tunable Dynamics
You can adjust several parameters to fine-tune the analysis:
Hop size: Controls responsiveness.
Smoothing window: Affects stability.
LUFS normalization: Ensures fair comparisons between different audio tracks.
Limits: The program's analysis is based on acoustics, not lyrics or semantics. Cultural and genre differences can affect interpretation, and the scores are relative unless a cross-track model is trained.
Why This Matters for Machine Learning & Edge Sensors
The same pipeline used for music can be applied to machine signals (e.g., from acoustic, vibration, current, or pressure sensors). By replacing "emotion" with "process state," you can analyze the health and behavior of machines.
Same 4-Stage Pipeline
Capture: An edge device samples sensors (e.g., a microphone or accelerometer) at a high frequency.
Preprocess: The signal is normalized, denoised, and smoothed with a fixed hop size.
Features (time–frequency):
"Arousal" analog (Excitation): RMS/overall energy, high-frequency content, impulse/onset rate, and crest factor.
"Valence" analog (Stability): Harmonicity vs. noise, spectral flatness, kurtosis, and the HPSS ratio.
Inference: You can start with the heuristic mapping and then train a CRNN on labeled machine events (e.g., scrap, chatter, bearing knocks).
Same Visuals, Now for Machines
Time-series: "Excitation" and "Stability" curves help you spot signs of issues like chatter or rubbing.
Phase-plane (trajectory): Provides a quick health view of the machine:
(+Stability, -Excitation) = smooth idle
(+Stability, +Excitation) = healthy high-load run
(-Stability, +Excitation) = risky impacts or chatter (alerts you to a problem)
(-Stability, -Excitation) = off or weak, but unstable (indicates alignment or rubbing issues)
Spectrogram overlay: Links alarms to specific frequencies, such as RPM sidebands or impact bands, helping you take corrective action.
Bottom Line
The music analysis tool is a great teaching and prototyping scaffold for edge analytics. It uses the same core Digital Signal Processing (DSP) and Machine Learning (ML) principles, but with different labels: energy and stability for machines instead of arousal and valence for music.
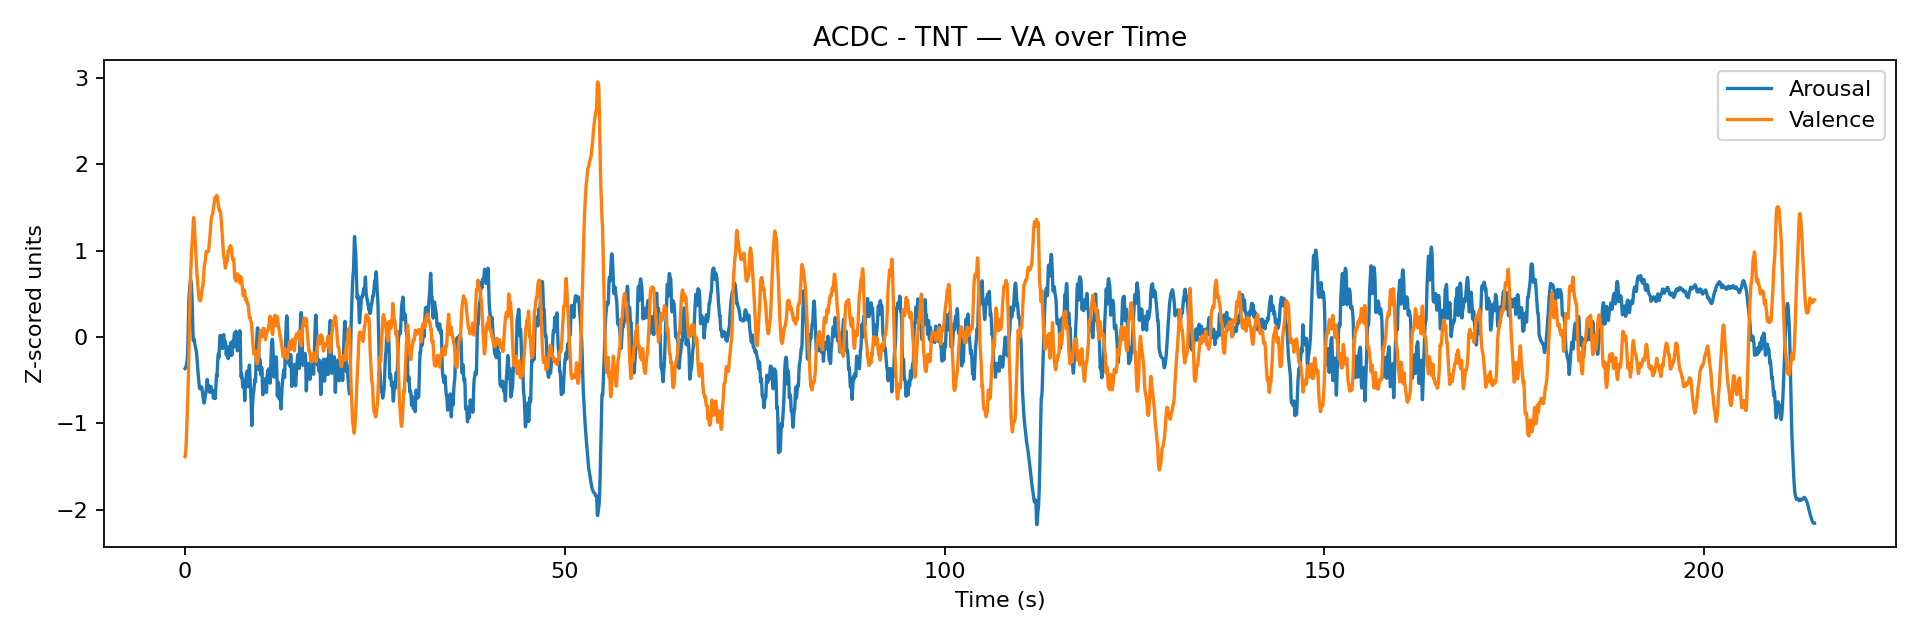
AC/DC – “TNT” shows short, spiky arousal bursts (blue) with several valence dips (orange) at the same moments—classic of distorted guitars + drum hits: high energy, but often tense/negative.
In “TNT,” the largest arousal peaks coincide with lower valence, so the song feels intense but not “happy.”
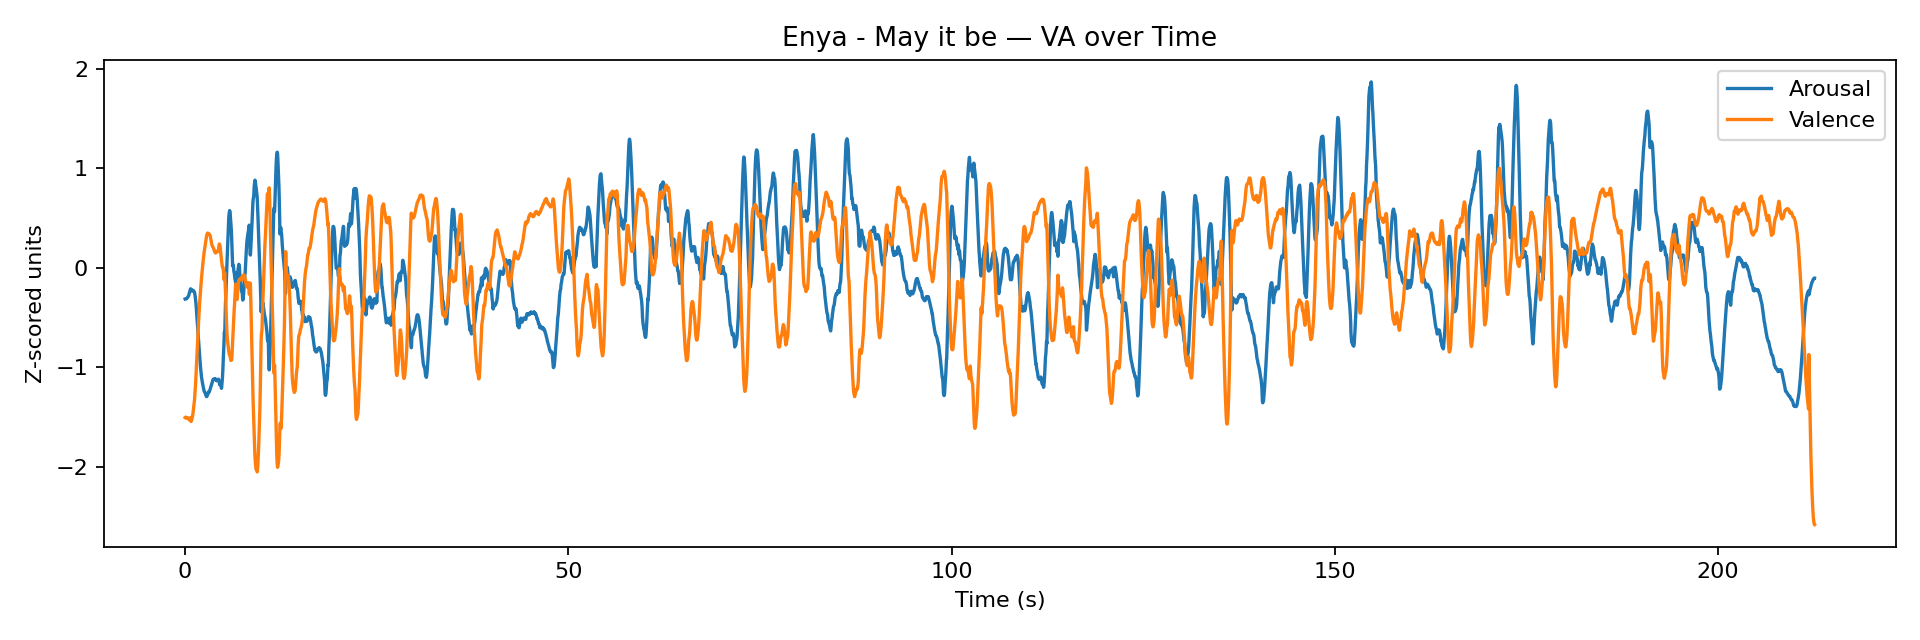
Enya – “May It Be” shows longer, smoother arcs with generally higher valence and a late arousal lift (a gentle crescendo): low/medium energy, more pleasant/tonal.
In Enya, arousal rises without big valence drops, so it feels moving yet calm/positive.
Note: the y-axis is relative per track (z-scores). You’re seeing each song’s own emotional changes over time, not absolute cross-song levels.
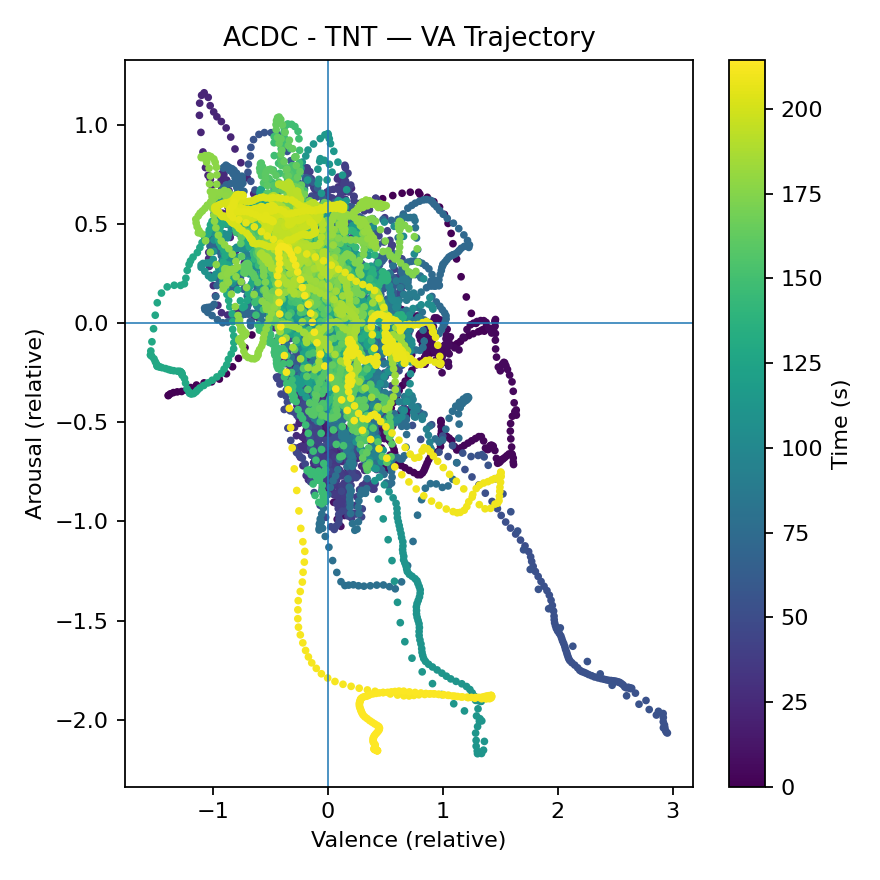
This is the valence–arousal (VA) trajectory for AC/DC – “TNT.”
Each dot = a short slice of the song. x = Valence (pleasant↔tense), y = Arousal (calm↔energetic).
Color = time (dark = start → yellow = end). The crosshair at (0,0) is the track’s mean.
What it’s telling you:
Lives in the upper-left: The densest cloud is high arousal, slightly negative valence → the track’s default state is energetic but tense/“aggressive.”
Strong negative slope (“banana”): As arousal rises, valence falls (and vice-versa). When the mix gets punchier/bright/percussive, it feels less pleasant; when it thins or turns more harmonic, valence lifts and arousal drops.
Big excursions at low arousal / high valence (right-bottom): Early/mid sections (darker blue/green) dive to valence +2–3 with arousal −2 → likely breakdowns/held chords/less percussion where the sound smooths out.
Ends back in the energetic cluster: Late points (yellow) return to high arousal near neutral/negative valence, consistent with a loud outro/chorus.
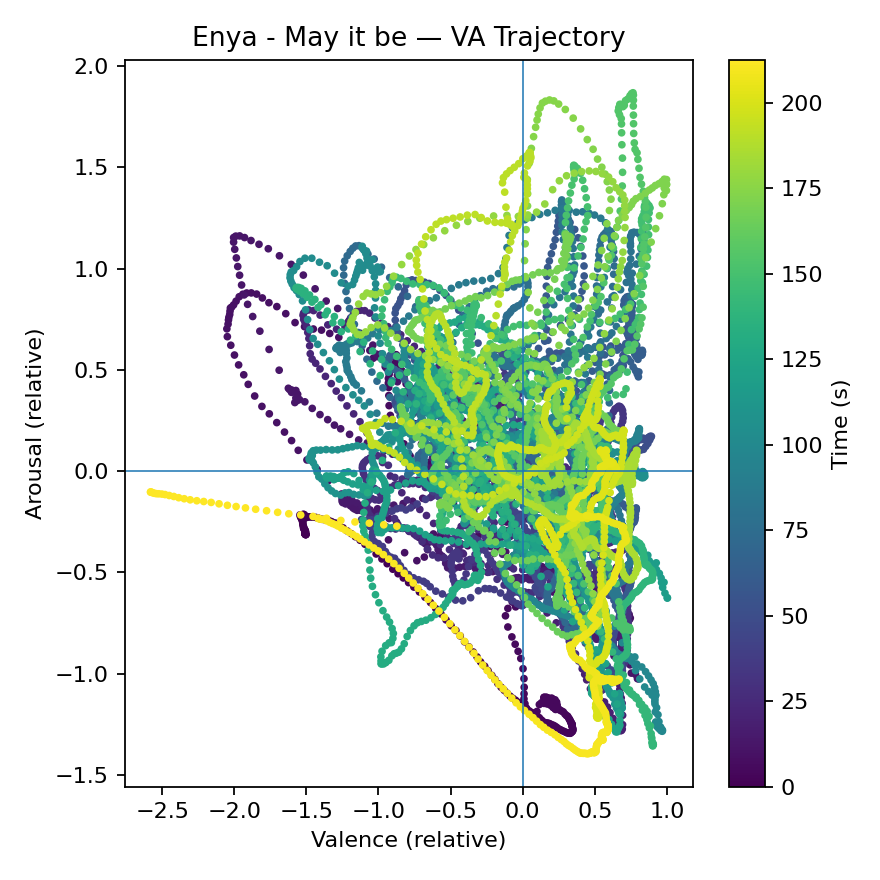
Baseline mood: Most points cluster right of center with arousal near zero → pleasant/positive valence and calm-to-moderate energy. That matches a mellow, soothing track.
Swells without harshness: You see loops that rise up-right into (+Valence, +Arousal), then drift back—gentle crescendos (added vocals/strings) that feel moving but not aggressive.
Relaxed passages: Frequent arcs down-right into (+Valence, −Arousal) show soft, sustained sections—still positive, just quieter/airier.
Intro dip: Early darker points briefly on the left (slightly negative valence) likely reflect a sparse/minor-tinged opening before harmony stabilizes.
Wind-down ending: The yellow tail trends down-right (positive valence, lowering arousal) → a calm, warm fade.
Coupling: Arousal changes don’t drag valence down much—energy varies, mood stays positive. Range is tighter than a rock track: no big spikes, more smooth arcs.
ACDC - TNT
Enya -May it be
Cause → effect visibility.
You can see what sonic events drive the scores.AC/DC – “TNT”: dense vertical stripes and bright high-frequency energy (cymbals/distorted guitars) line up with arousal spikes; when the spectrum gets very bright/noisy, valence dips—evidence that percussive brightness/roughness is pushing “excited but tense.”
Enya – “May It Be”: smoother, sustained bands with less top-end hash correlate with higher valence and lower, steadier arousal; gentle swells (wider bands growing together) raise arousal without dragging valence down.
Section & mix diagnostics.
You can spot breaks, drops, crescendos, and arrangement changes (texture thins or thickens) and verify the model isn’t reacting to artifacts (silence trims, harsh edits, MP3 noise). It’s also handy for tuning: if arousal jumps are tied mainly to very high bands, you might lower centroid weight; if valence rises on stable harmonic bands, you’re seeing the majorness/harmonic-ratio features doing work.
Bottom line: the overlays don’t add new metrics, but they add interpretability—they show why the VA curves move, and let you debug/tune the mapping with concrete spectral evidence.
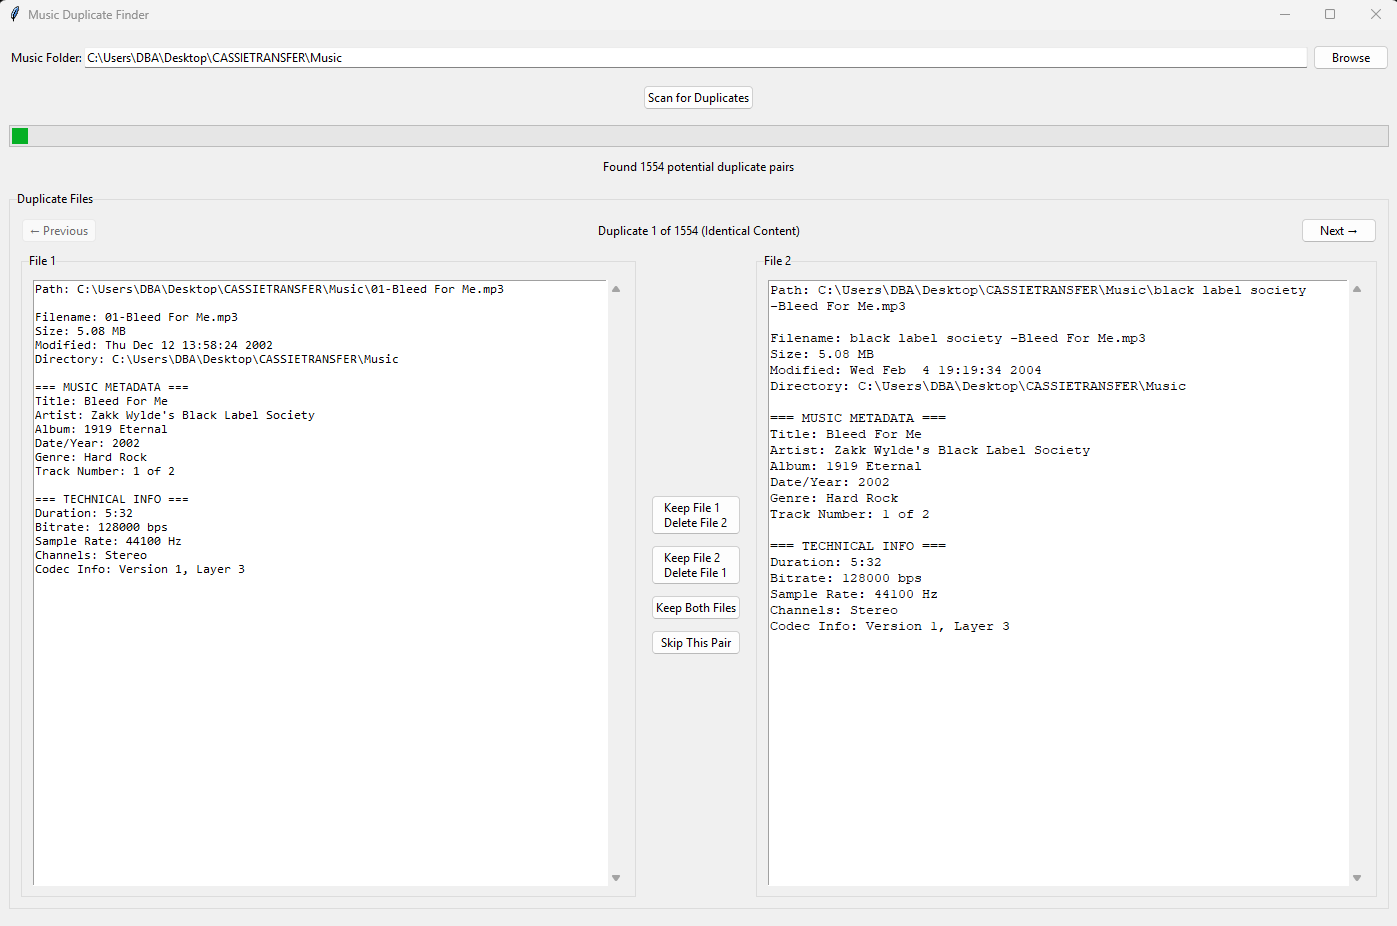
Got too much music to go thru and find duplicates? Try this, I "wrote" it: